Recovery Metrics, KPIs, and SLA Management

Deduction management should be measured with clear KPIs, operational metrics, and service-level expectations. These measures help companies understand not only how much is being recovered but also how effectively deductions are being researched, assigned, disputed, escalated, and resolved.

For companies with a Shared Services Organization (SSO) or Global Business Services (GBS) model, deduction metrics are especially important because ownership may span multiple teams, including Accounts Receivable, Cash Application, Sales, Trade, Pricing, Logistics, Compliance, Customer Service, and Supply Chain.

A strong reporting structure should answer three core questions:

  1. What is open?
    The value, volume, age, and type of open deductions.
  2. Who owns it?
    The person, team, or department responsible for the next action.
  3. How well is it being worked?
    Whether deductions are being researched, documented, disputed, approved, escalated, or resolved within expected timeframes.

Core Deduction Management KPIs

Recommended KPIs include:

  • Total deductions taken
  • Total open deduction balance
  • Open deductions by customer
  • Open deductions by deduction type
  • Open deductions by age
  • Open deductions by owner
  • Dollars researched
  • Dollars disputed
  • Dollars recovered
  • Recovery rate
  • Write-off rate
  • Average days to resolution
  • Dispute approval/denial rates
  • Percent of deductions researched within target timeline
  • Percent of deductions with backup obtained
  • Percent of deductions awaiting internal response
  • Percent of deductions awaiting customer response
  • Top recurring deduction reasons
  • Repeat deductions by customer
  • Analyst productivity
  • Aging by status and next action


SLA Metrics for Shared Services / SSO / GBS Organizations

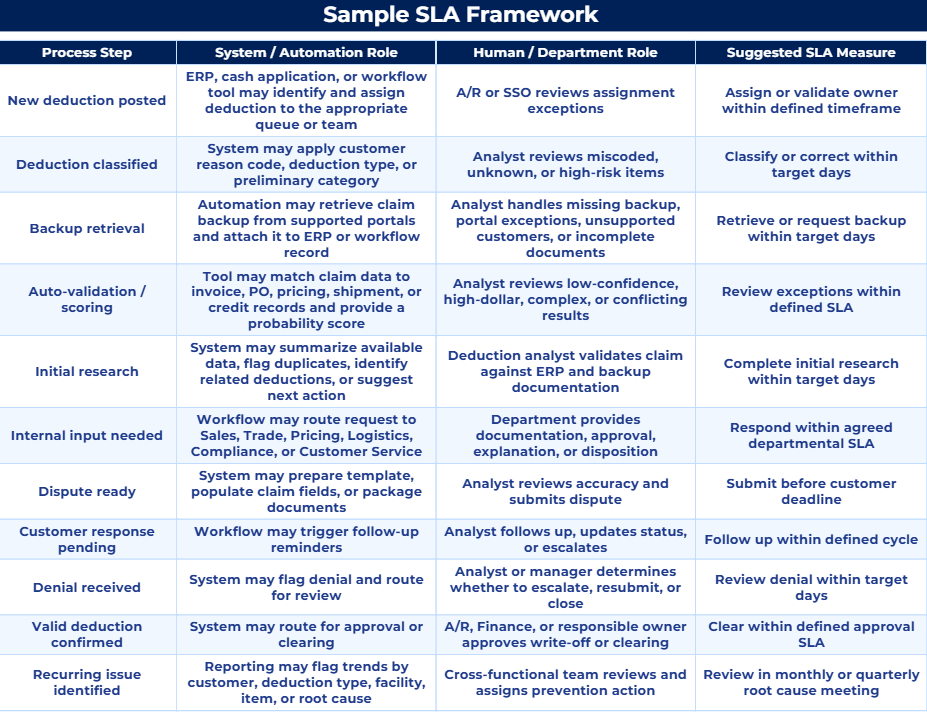
In an SSO or GBS environment, service-level agreements help ensure deductions do not stall between systems, analysts, and functional teams. SLAs should define how quickly each step should be completed, what the system is expected to handle, when human review is required, and which department is responsible for the next action.

Many CPG companies use ERP workflows, deduction management tools, SaaS platforms, automation, or AI-supported scoring to streamline parts of the deduction process. For example, systems may assign deductions during cash application, retrieve and attach available backup to the ERP, match claims to invoices or purchase orders, or provide an auto-validation result or probability score.

These tools can improve speed and consistency, but they should be supported by clear exception handling. Human review is still needed when documentation is missing, confidence scores are low, claim details conflict with ERP data, deductions are high-value, or the issue requires business judgment.

Infographic titled “Sample SLA Framework” showing a deduction management workflow with four columns: Process Step, System/Automation Role, Human/Department Role, and Suggested SLA Measure. Steps include new deduction posting, classification, backup retrieval, validation, research, dispute submission, customer response follow-up, denial review, write-off approval, and recurring issue identification. The chart illustrates how automation and employees share responsibilities while tracking performance through defined service-level agreements (SLAs).

Key Point: SLAs should measure both automated workflow performance and human follow-through. Automation can move deductions faster, but exceptions still need clear ownership, timing, and escalation.

System and Automation Metrics

When technology is part of the deduction workflow, companies should measure how well the system is supporting the process. This is especially important when deductions are assigned, coded, scored, validated, or documented through ERP workflows, SaaS tools, or automation.

Recommended metrics include:

  • Percent of deductions auto-assigned successfully
  • Percent of deductions requiring reassignment
  • Percent of claims with backup automatically retrieved
  • Percent of claims requiring manual backup retrieval
  • Percent of deductions auto-matched to invoice, PO, shipment, or agreement
  • Percent of deductions flagged as exceptions
  • Auto-validation confidence score distribution
  • Percent of low-confidence claims requiring analyst review
  • Percent of system-suggested dispositions accepted by analysts
  • Percent of system-suggested dispositions overridden by analysts
  • Aging of automation exceptions
  • Number of failed portal retrieval attempts
  • Unsupported customer or portal volume
  • Time saved through automated retrieval or assignment
  • Error rate in automated coding or matching

Automation Insight: If a system retrieves backup for 80% of claims, the remaining 20% should not disappear into the process. Those exceptions need owners, due dates, and escalation paths.

Auto-Validation and Probability Scoring

Some deduction management tools may auto-validate claims or provide a probability score based on available data. These tools may compare customer claim information against ERP records, invoice detail, purchase orders, pricing files, shipment data, credit memo history, or prior deduction patterns.

This can help teams prioritize work by identifying claims that are likely valid, likely invalid, duplicate, incomplete, or requiring additional review.

However, probability scores should not be treated as a final disposition without appropriate controls. Low-confidence claims, high-dollar deductions, complex trade or compliance claims, claims with missing documentation, and claims involving multiple related deductions should still be reviewed by experienced analysts.

Auto-validation may help answer:

  • Does the deduction match an invoice, PO, or shipment?
  • Is the claim amount consistent with available data?
  • Was a credit already issued?
  • Does the claim appear to be a duplicate?
  • Is backup available?
  • Does the claim fall within expected tolerances?
  • Is the deduction likely valid, invalid, or exception-based?

But human review is still needed to determine:

  • Whether customer backup is complete and accurate
  • Whether the deduction is allowed under the agreement
  • Whether multiple deductions overlap
  • Whether the claim is partially valid
  • Whether the issue requires Sales, Trade, Pricing, Logistics, or Compliance input
  • Whether the claim should be disputed, cleared, escalated, or included in a Safety Net Review

Key Point: Auto-validation can help prioritize and accelerate the review of deductions, but probability is not proof. Final disposition should still consider documentation, ERP reconciliation, customer agreements, and analyst judgment.

Ownership Tracking

Every open deduction should have a clearly assigned owner, next action, due date, and status. In automated environments, ownership should distinguish between system-driven steps and human exception handling.

Recommended ownership fields include:

  • Current owner
  • Responsible department
  • System-generated status
  • Analyst-confirmed status
  • Automation result
  • Auto-validation score or confidence level
  • Exception reason
  • Next action required
  • Date assigned
  • Due date
  • SLA status
  • Escalation status
  • Internal dependency
  • Customer dependency
  • Pending documentation
  • Last system action date
  • Last human action date
  • Next follow-up date
  • Final disposition owner


Key Point: An open deduction should never be “just open.” It should have a system status, a human owner when needed, a next action, a due date, and clear accountability.

Management Questions KPIs Should Answer

Strong deduction reporting should help leadership answer:

  • How much is open?
  • How old is the open balance?
  • Who owns each open deduction?
  • What is the next action?
  • Which deductions are at risk of missing dispute windows?
  • Which departments are causing delays?
  • Which customers or deduction types are driving the backlog?
  • Which team members are carrying the largest workloads?
  • How quickly is backup being retrieved?
  • How quickly are disputes being submitted?
  • How often are disputes successful?
  • How much is being written off?
  • How much could be prevented?
  • Which root causes are recurring?
  • Are Shared Services SLAs being met?

SSO Visibility Matters: In a Shared Services model, deduction performance should be measured by more than recovery dollars. Companies should also track ownership, next action, SLA compliance, internal response times, and departmental bottlenecks.

Executive Dashboards and Leadership Reporting

Operational metrics help teams manage deductions, but executive leaders require a different perspective. Finance leaders, Controllers, CFOs, Shared Services leaders, and Private Equity stakeholders typically focus on financial exposure, recovery opportunity, working capital impact, and trend visibility.

Executive Questions Every Deduction Program Should Answer

  • How much cash is currently tied up in open deductions?
  • How much of the open balance is potentially recoverable?
  • Which customers create the largest deduction exposure?
  • What deductions are approaching dispute deadlines?
  • Which deductions are most likely to become write-offs?
  • What recurring deduction categories are creating ongoing losses?
  • Which departments are contributing to delays?
  • What amount is currently at risk due to aging?
  • What recovery opportunities exist within historical write-offs?
  • Is deduction performance improving over time?

Executive Dashboard Components

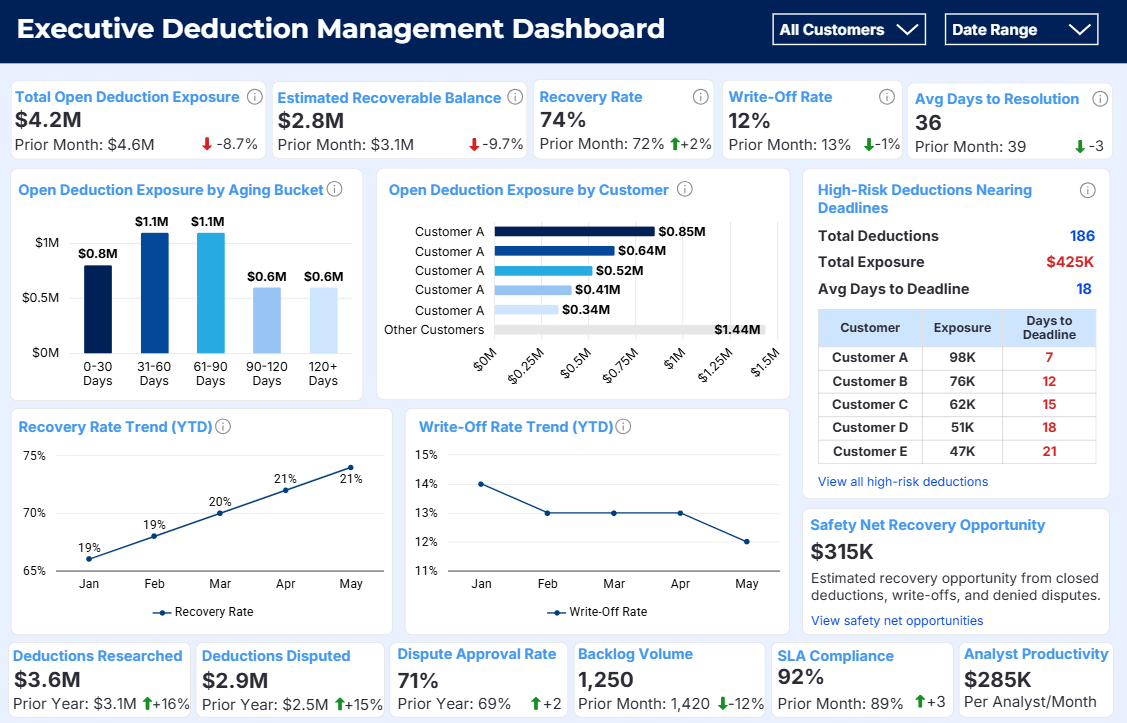
An executive dashboard may include:

  • Total open deduction exposure
  • Recoverable deduction estimate
  • Open balance by customer
  • Open balance by aging category
  • Recovery rate trends
  • Write-off trends
  • Top recurring deduction categories
  • Customer concentration risk
  • Dispute approval rates
  • Safety Net recovery opportunities
  • High-risk deductions nearing deadlines


IAB Insight: Many organizations measure deduction success primarily by dollars recovered, but recovery is often a lagging indicator. The strongest deduction programs also monitor aging, ownership, SLA compliance, dispute effectiveness, root causes, and bottlenecks across departments. When leaders can see not only what has been recovered, but also what is stalled, at risk, or driving recurring losses, they are better equipped to improve cash flow, reduce write-offs, and prevent future deductions from occurring in the first place.

Executive Insight: An effective dashboard does more than show deduction volume. It helps leadership understand where cash is tied up, where revenue recovery opportunities exist, and where corrective actions can reduce future exposure.

Infographic titled “Executive Deduction Management Dashboard” displaying key deduction management KPIs, including total open deduction exposure, estimated recoverable balance, recovery rate, write-off rate, and average days to resolution. The dashboard includes charts showing deduction aging, exposure by customer, recovery and write-off trends, high-risk deductions nearing deadlines, and revenue recovery opportunities. Additional metrics track deductions researched and disputed, dispute approval rates, backlog volume, SLA compliance, and analyst productivity.

Download our free, comprehensive Deduction Management Guide

Enter your email below to access 50+ pages of practical insights, best practices, recovery strategies, technology considerations, KPIs, and checklists for building a more effective deduction management program.

Get Started

Work with our professional, experienced and stable management team to fill your accounts receivable outsourcing needs.